Page 10 sur 28
Merge, concatenate, append
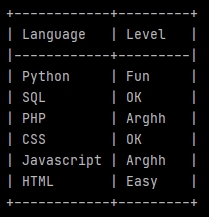
Merge 2 lists in 2 columns and properly display them in the terminal

import pandas as pd
from tabulate import tabulate

LanguageList = ['Python', 'SQL', 'PHP', 'CSS', 'Javascript', 'HTML']
LevelList = ['Fun', 'OK', 'Arghh', 'OK', 'Arghh', 'Easy']

LanguageLevel = list(zip(LanguageList, LevelList))

df = pd.DataFrame(LanguageLevel, columns =['Language', 'Level'])

print(tabulate(df, headers='keys', tablefmt='psql', showindex=False))
The 7th line uses zip to link the values from our lists in tuples. list encloses our tuples in a list.
The 9th line creates a data-frame (pd.DataFrame) from our new list (now containing tuples). Specifying the column labels.
The print uses tabulate to display our fields with a beautiful Postgres style (psql).
Split a dataframe with conditions, and them merge the splits according other conditions
firstSelection = df.loc[df['Field'] == 'Yes'].head(100)

secondSelection = df.loc[df['Field'] == 'No'].head(200)

# Merge the 2 selections.
df_Selections = pd.concat([firstSelection, secondSelection], axis=0)
Concatenate dataframes in a loop
df_Concatenation = pd.DataFrame()

for ... :
    df...
    df_Concatenation = pd.concat([df_Concatenation, df], axis=0)
Aggregate files
Imagine that you want to iterate through a directory, which itself contains other directories, to aggregate Excel files contained in each of the subdirectories:
Context:
- The main directory is here named _ForAnalysis in C.
- The name of each subdirectories contains the word typical directory.
- The files that you would to aggregate are named Typical file.xlsx.
- Each Excel file contains a sheet named Typical sheet with a Field1 and a Field2.
Code:
from termcolor import colored
import os
import pandas as pd
from tabulate import tabulate

# workDirectory
workDirectory = 'C:/_ForAnalysis/'
print('\nWork directory: ' + workDirectory)

TypicalFile = 'Typical file.xlsx'
NumberTypicalFile = 0

df_CumulatedFiles = pd.DataFrame()

print(colored('\nCheck typical files (' + str(len(os.listdir(workDirectory))) + '):', 'blue'))

for rep in os.listdir(workDirectory):
    if 'typical directory' in rep:
        NumberTypicalFile += 1

        TypicalPath = os.path.join(workDirectory, rep)
        TypicalPath = TypicalPath + '/' + TypicalFile

        print(TypicalPath)

        df_TypicalFile = pd.read_excel(TypicalPath, sheet_name='Typical sheet', engine='openpyxl', usecols=['Field1', 'Field2'])

        # DISPLAY ONE BY ONE
        print(tabulate(df_TypicalFile.head(10), headers='keys', tablefmt='psql', showindex=False))
        print(str(df_TypicalFile.shape[0]), 'commune(s)')
        print('')

        # FILES CONCATENATION
        df_CumulatedFiles = pd.concat([df_CumulatedFiles, df_TypicalFile], axis=0)

print(colored('\n' + str(NumberTypicalFile) + ' file(s) have been aggregated:', 'blue'))
print(tabulate(df_CumulatedFiles.head(10), headers='keys', tablefmt='psql', showindex=False))
print(str(df_CumulatedFiles.shape[0]), 'lines')
Fill a dataframe from a list (append)
df = pd.DataFrame()

for l in MyList:
    dfTemp = pd.DataFrame({
        'Field 1': 'Georges',
        'Field 2': [l]
    })

df = pd.concat([df, dfTemp], axis=0)

print('\ndf :')
print(tabulate(df.head(2), headers='keys', tablefmt='psql', showindex=False))
print(df.shape[0])